This part is Core content (syllabus 9.2.3 and part of 9.2.4).
You cannot see a heart beating inside the chest, but you can still follow what it does. A doctor listens to it, a nurse feels it at the wrist, and a hospital machine draws it as a line on paper. Each method picks up something different about the same heartbeat. In this part you find out what each one shows and how to get a heart rate from it: the number of beats in one minute.
 (enlarge)
Three ways to watch the heart
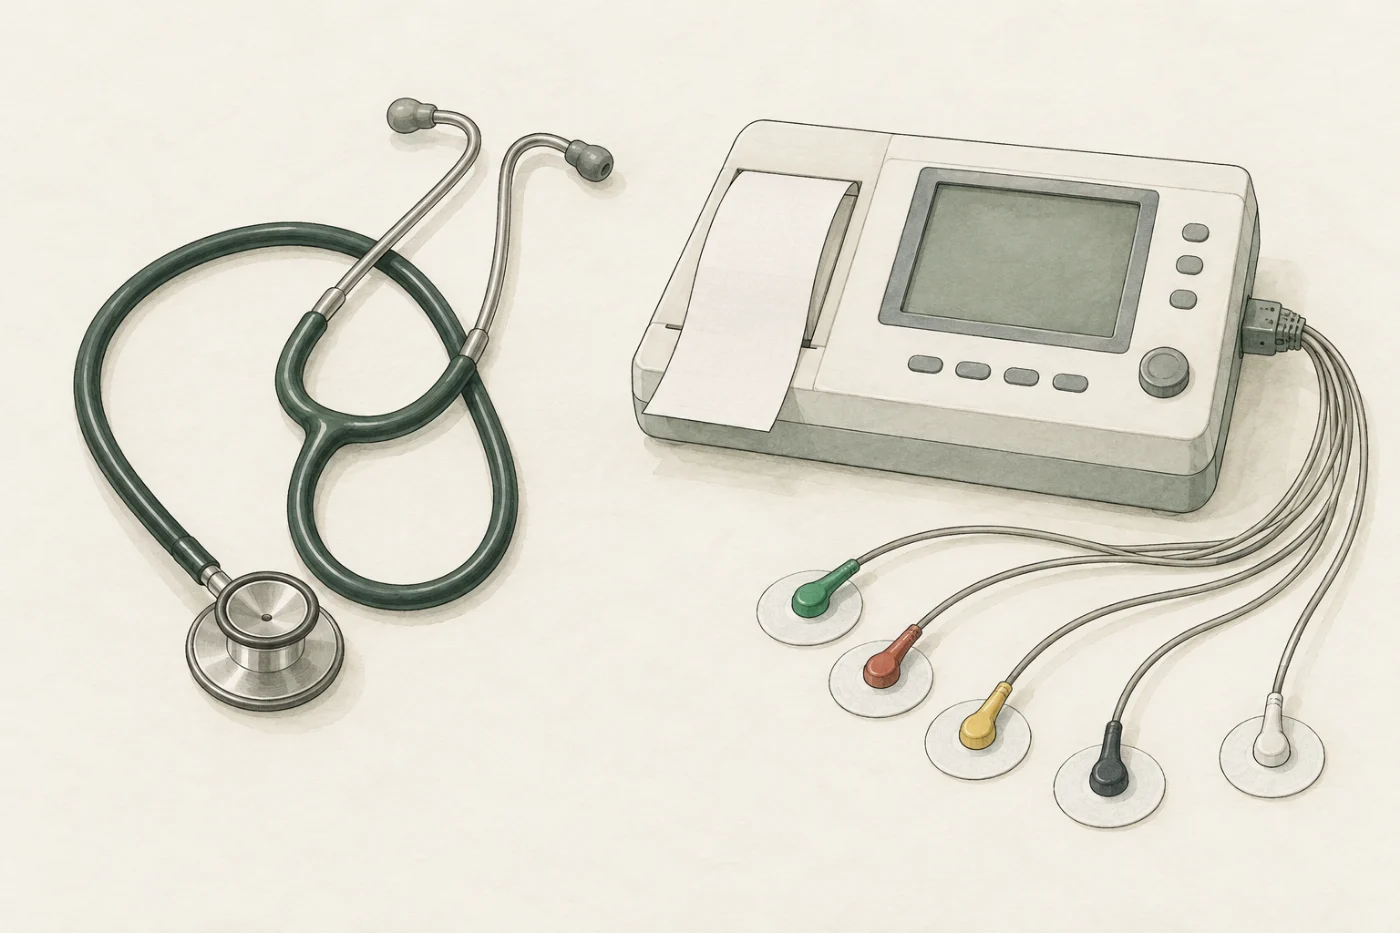
The activity of the heart can be monitored in three ways:
- an ECG (electrocardiogram) records the electrical activity of the heart;
- the pulse rate counts the heartbeats felt in an artery;
- a stethoscope lets you listen to the sounds of the valves closing.
The ECG: an electrical trace
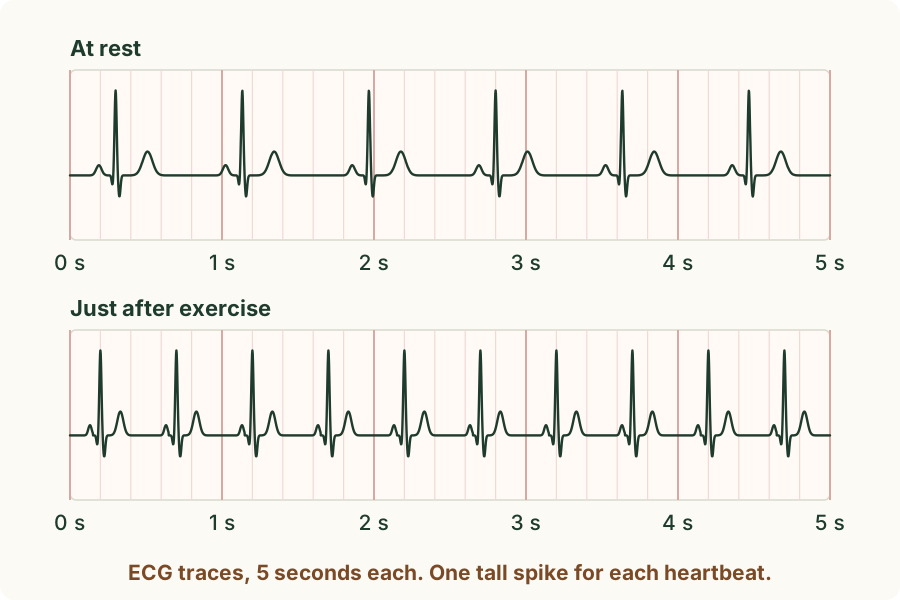
Before the heart muscle contracts, a tiny electrical signal spreads through it. An ECG records this electrical activity. Sticky pads, called electrodes, on the skin of the chest and limbs pick up this signal, and the machine draws it as a line, called a trace, on squared paper or a screen. The line has the same pattern for every beat: a small bump, a tall narrow spike, then a rounded bump. So you can count the beats by counting the tall spikes.
 (enlarge)
Worked example
A heart rate from an ECG trace
The top trace in the figure lasts 5 seconds and has 6 tall spikes. What is the heart rate?
A minute is 60 seconds, which is 12 lots of 5 seconds. So the heart beats 6 × 12 = 72 beats per minute. Another way: the spikes are about 0.83 s apart, and 60 ÷ 0.83 = 72 beats per minute. The bottom trace has 10 spikes in 5 seconds: 10 × 12 = 120 beats per minute, much faster.
The pulse: a surge in an artery
Each time the left ventricle contracts, it pushes a surge of blood into the aorta and on into the arteries. The surge stretches the elastic wall of each artery for a moment. Where an artery runs close to the skin over a bone, you can feel this as a pulse: one pulse for each heartbeat. So the pulse rate is the same as the heart rate.
The usual place is the inside of the wrist, just below the thumb. A count of the pulses for a short time is turned into beats per minute:
heart rate (beats per minute) = number of beats counted ÷ time counted (in minutes)
Trap: "The pulse is the heart beating in the wrist." The heart stays in the chest. The pulse is the wall of an artery being stretched by the surge of blood that the ventricle has just pushed out.
Worked example
A pulse count
A pulse is counted for 15 seconds and 18 beats are felt. What is the heart rate?
15 seconds is a quarter of a minute (0.25 min), so the heart rate is 18 ÷ 0.25 = 18 × 4 = 72 beats per minute. A count of 36 beats in 30 seconds gives the same answer: 36 × 2 = 72. In general, heart rate in beats per minute = beats counted ÷ time counted in minutes.
The stethoscope: the sounds of the valves
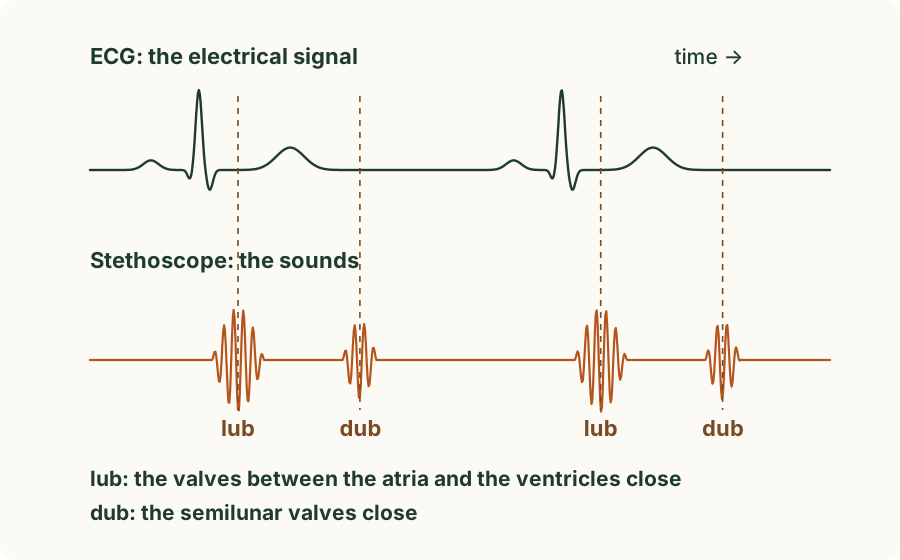
Through a stethoscope pressed on the chest you hear two sounds in each heartbeat, often written "lub" and "dub". They are the sounds of the heart's valves closing:
- "lub": the valves between the atria and the ventricles close as the ventricles start to contract;
- "dub": the semilunar valves, where the aorta and the pulmonary artery leave the ventricles, close as the ventricles relax.
 (enlarge)
Trap: "The sounds are made by the heart muscle squeezing." The muscle contracting makes almost no sound you can hear. The lub and the dub are made by valves snapping shut, so a stethoscope tells a doctor whether the valves close properly.
Worked example
Counting sounds
Someone listening through a stethoscope counts 140 sounds in one minute. A pupil writes "heart rate = 140 beats per minute". Explain the mistake.
Each heartbeat makes two sounds, a lub and a dub. 140 sounds are 140 ÷ 2 = 70 beats, so the heart rate is 70 beats per minute. Count only the lubs, or count pairs.
Predict, then measure
In the experiment below a volunteer sits on a stool beside the bench. You measure their heart in all three ways: you count the pulse at the wrist, listen through the stethoscope and print an ECG. Later in the module the volunteer does a step test.
Predict first: when the volunteer steps up and down for three minutes and then sits down, what will a graph of their heart rate look like? Make your prediction in the experiment, then count the resting pulse. The heart rates in this module are typical values for one teenage volunteer, not a standard that anyone should reach.
What the measurements showed
At rest the volunteer's pulse count was about 18 beats in 15 seconds: 72 beats per minute. The ECG printed 6 tall spikes in 5 seconds, the same 72 beats per minute, and the stethoscope picked up one lub and one dub in each beat. Three methods, one heart rate.
Key idea: The activity of the heart can be monitored by an ECG (a trace of its electrical activity, one tall spike for each beat), by the pulse rate (a surge of blood stretching an artery wall at each beat, felt at the wrist) and by listening through a stethoscope to the sounds of the valves closing (lub: the valves between the atria and the ventricles; dub: the semilunar valves). Heart rate = beats counted ÷ time counted in minutes; a 15 s count is multiplied by 4.