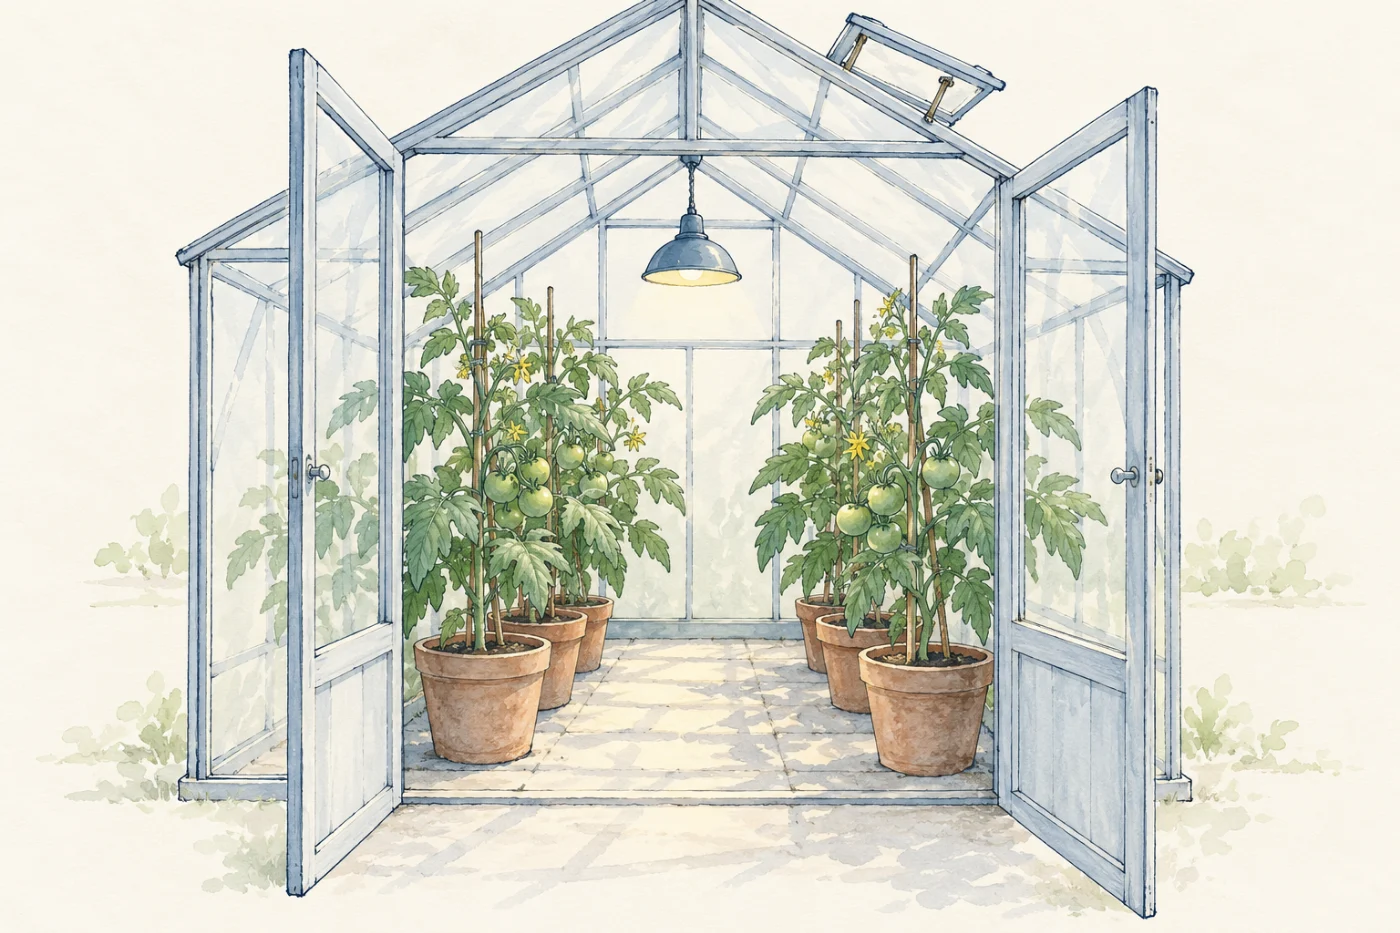
A tomato grower wants as many tomatoes as possible from one greenhouse. Every tomato is built from the glucose that the leaves make by photosynthesis, so the grower wants the plants to photosynthesise as fast as they can. On a winter morning the greenhouse may be cold; on a summer afternoon it may be hot and bright with the doors shut. Some growers heat the air, some hang lamps over the plants, and some even pump extra carbon dioxide in. Which of these helps, and when? To answer that, you need a way to measure how fast a plant photosynthesises, and then change one condition at a time. In this part you measure the rate with a water plant, change the light, the carbon dioxide and the temperature, and find out what holds the rate back.
 (enlarge)
Bubbles you can count
You already know that photosynthesis gives out oxygen. A land plant gives its oxygen out into the air, where you cannot see it. A water plant such as the pondweed Elodea gives it out into the water, and some of it comes out of a cut stem as small bubbles. The faster the plant photosynthesises, the more bubbles rise each minute. So the number of bubbles per minute is a way to measure the rate of photosynthesis: how much photosynthesis happens in a given time.
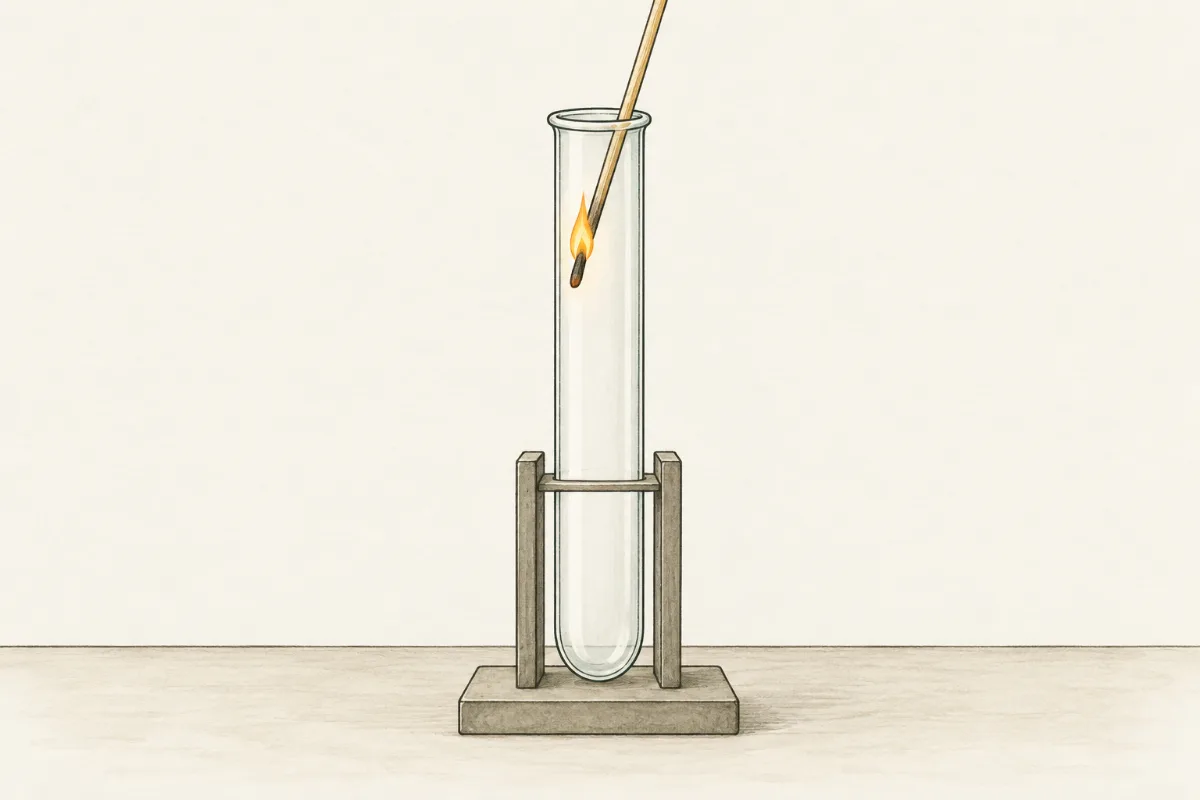
Is the gas really oxygen? Collect it over the plant in an upside-down test tube full of water until the gas has pushed some water out. Close the tube with your thumb under the water, lift it out, turn it the right way up and push in a glowing splint. The splint relights, so the gas is mainly oxygen.
 (enlarge)
The plant also respires, in the light as well as in the dark, every minute of the day. Respiration uses up some of the oxygen that photosynthesis makes. So the bubbles are the oxygen left over: what photosynthesis makes, minus what respiration uses. When photosynthesis is fast, there is plenty left over and the bubbles come quickly.
Trap: "In the light a plant photosynthesises instead of respiring." A plant's cells respire all the time, in light and dark. In the light, photosynthesis makes oxygen faster than respiration uses it, so oxygen is given out.
Free play: nothing here is marked or saved
The grower's three dials
On a dull winter day a tomato grower can switch on lamps, let carbon dioxide in from a cylinder and turn up the heating. Every dial costs money. Which one makes the plants photosynthesise faster?Supplement
Try: Let more carbon dioxide in. Does the rate change?
- With this light
- up to 30 %
- With this CO₂
- up to 52 %
- At this temperature
- up to 68 %
- Rate
- 30 %
rate = the smallest of 30 %, 52 % and 68 % = 30 %: light limits it
- Each dial sets the fastest the plants could go with that much light, carbon dioxide or warmth. The rate is the smallest of the three; that factor is the limiting factor.
- Turning up a factor that is not limiting changes nothing, so a grower pays only for the dial that limits the rate.
- Above about 25 °C these plants slow down again: it is too hot for their enzymes.
About this model. The numbers are a teaching model in % of the fastest these plants can go, with straight lines and a sharp switch from one limit to the next; real leaves change over more gently, and the best temperature depends on the plant. The daylight stays a dull winter light and the lamps add to it. Ordinary air has 0.04 % carbon dioxide; growers raise it to about 0.1 %.
A fair test
The method used in school labs:
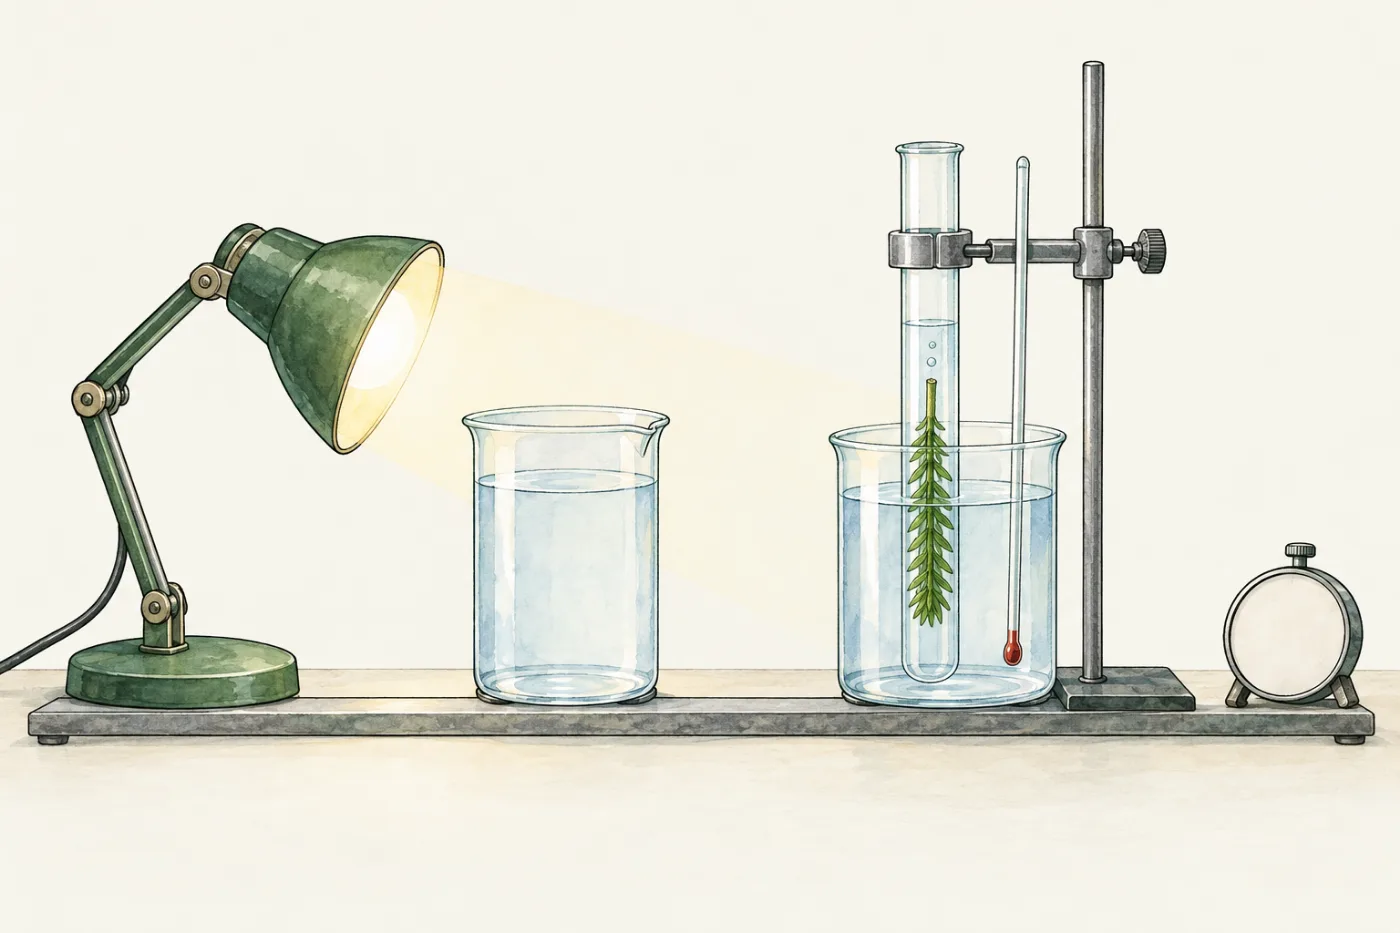
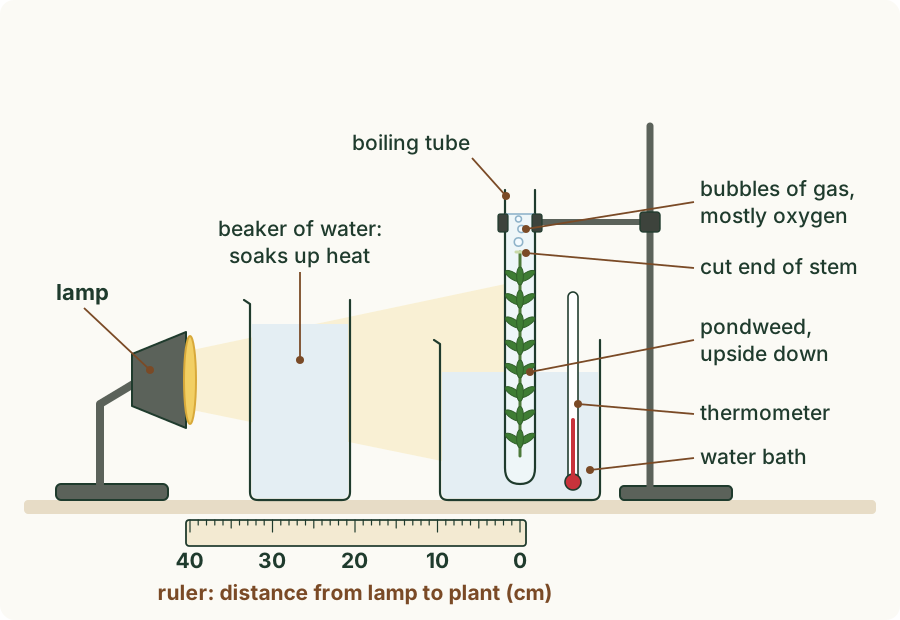
- Cut a fresh sprig of pondweed under water, and place it upside down in a boiling tube of water, so the cut end of its stem is uppermost, still under the water. The bubbles come out of the cut end, where they are easy to count.
- Clamp the tube in a beaker of water, a water bath, with a thermometer in it. The water bath keeps the temperature steady, and the thermometer shows that it has stayed the same.
- Put a lamp beside it on a ruler, so you can set the distance from the lamp to the plant. Darken the room, so the lamp is the only bright light on the plant.
- Stand a beaker of water between the lamp and the tube. A lamp gives out heat as well as light, and the water soaks up much of the heat. Without it, moving the lamp closer would also warm the plant, and you could not tell whether the light or the heat changed the rate.
- After each change, wait about 2 minutes before counting, to let the plant adjust to its new conditions.
- Count the bubbles for 1 minute. Then count for another minute, and work out the mean of the two counts.
 (enlarge)
 (enlarge)
In each test you change one thing, the independent variable, such as the distance of the lamp. You measure the dependent variable, the number of bubbles per minute. Everything else stays the same: these are the controlled variables. Here they are the same sprig of pondweed, the same water, the same temperature, the same lamp, the same waiting time and the same counting time.
The distance is what you set, not the brightness itself. A closer lamp gives brighter light on the plant (a higher light intensity), but the distance does not tell you exactly how much brighter. So your results are recorded against the distance, and read as "the closer the lamp, the brighter the light".
Two counts are better than one. Two one-minute counts of the same plant in the same conditions are seldom exactly the same, so the mean of the two is a more reliable result than either count alone. If the two counts are very different, count again.
Bubbles are a rough measure
Counting bubbles is quick, and good enough to show which way the rate changes. But it is a rough measure, for four reasons:
- The bubbles are not all the same size, so ten bubbles is not always the same volume of gas.
- Some of the oxygen dissolves in the water and is never seen as bubbles.
- The gas is mainly oxygen, but not pure oxygen: it also holds a little nitrogen and carbon dioxide from the water.
- No bubbles does not prove there is no photosynthesis. In dim light the plant may make only a little more oxygen than it uses in respiration, and that little may all dissolve.
A better measure collects the gas: it is trapped at the top of a narrow tube, and the length or volume of the gas collected in a fixed time is measured.
Trap: "No bubbles means the plant is not photosynthesising." The plant may be photosynthesising slowly, with all of its spare oxygen dissolving in the water or used in respiration.
Predict first: as the lamp comes closer to the plant, what will happen to the number of bubbles each minute? What will extra carbon dioxide do, and warmer water? Write your predictions down now. Below you can try the first step, one count of bubbles with the lamp 40 cm from the plant; the full experiment tests four distances, extra carbon dioxide and two warmer temperatures. Then read on and compare your predictions with the results.
After the experiment: reading the results
The counts here come from an illustrative simulation of pondweed, set up to behave the way real pondweed usually does. Real counts vary more, and your numbers in a school lab will be different.
| Conditions | Count 1 | Count 2 | Mean bubbles per minute |
|---|---|---|---|
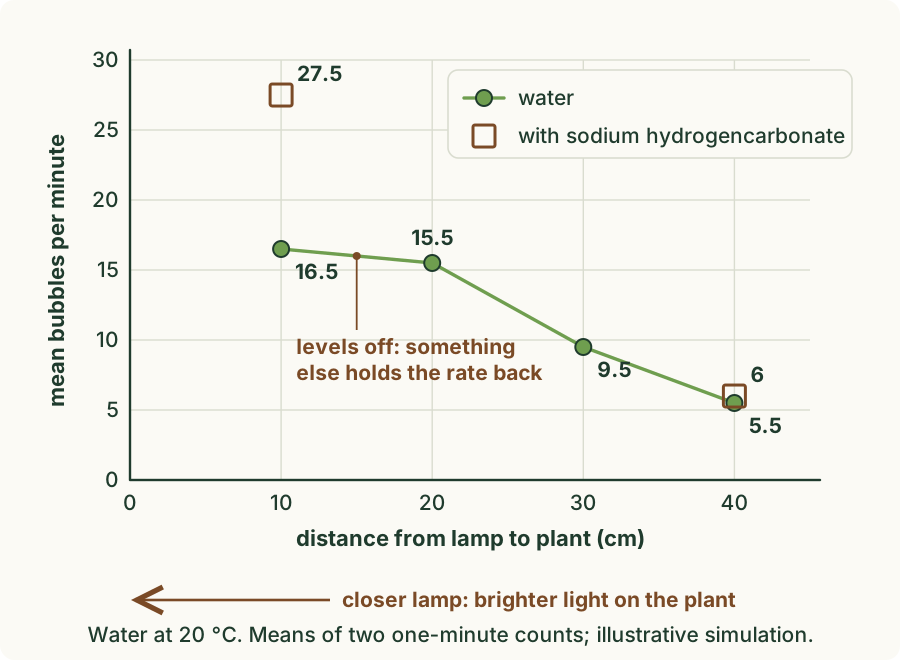
| 40 cm, water, 20 °C | 6 | 5 | 5.5 |
| 30 cm, water, 20 °C | 10 | 9 | 9.5 |
| 20 cm, water, 20 °C | 16 | 15 | 15.5 |
| 10 cm, water, 20 °C | 17 | 16 | 16.5 |
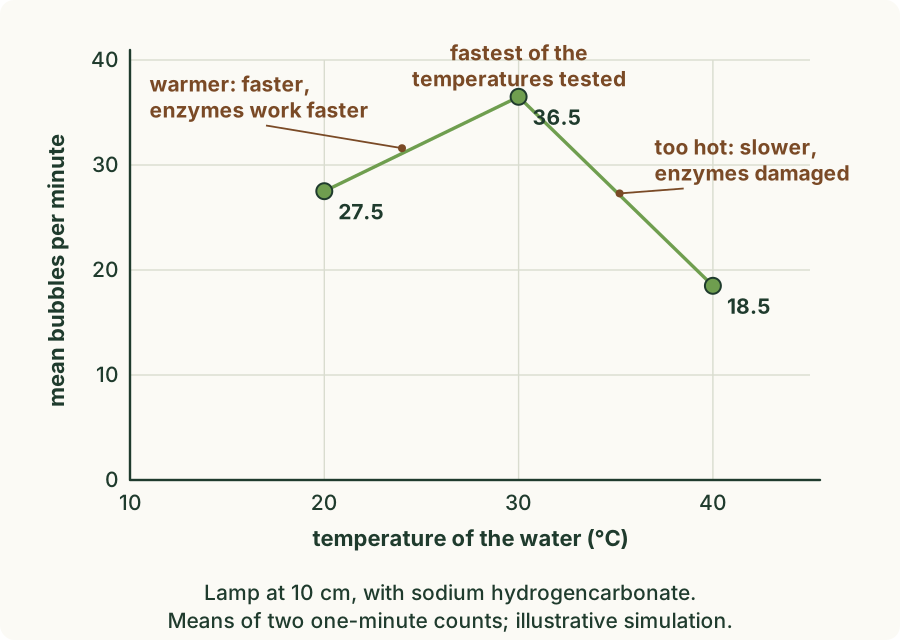
| 10 cm, with sodium hydrogencarbonate, 20 °C | 28 | 27 | 27.5 |
| 40 cm, with sodium hydrogencarbonate, 20 °C | 6 | 6 | 6 |
| 10 cm, with sodium hydrogencarbonate, 30 °C | 37 | 36 | 36.5 |
| 10 cm, with sodium hydrogencarbonate, 40 °C | 19 | 18 | 18.5 |
To find each mean, add the two counts and divide by 2. At 40 cm in water: (6 + 5) ÷ 2 = 5.5 bubbles per minute.
Light. As the lamp came closer, from 40 cm to 20 cm, the rate rose from 5.5 to 15.5 bubbles per minute. Brighter light gives more energy for photosynthesis, so the rate increases. But from 20 cm to 10 cm it rose by only 1 bubble per minute, even though the light on the plant was brighter still. The graph levels off. Something other than light was now holding the rate back.
 (enlarge)
Carbon dioxide. Carbon dioxide is a raw material of photosynthesis, and the pondweed takes it from the water around it. Sodium hydrogencarbonate solution is colourless; a little of it added to the water is a source of extra carbon dioxide for the plant, so it raises the carbon dioxide concentration. With the lamp at 10 cm, it raised the rate from 16.5 to 27.5 bubbles per minute: in bright light, more carbon dioxide made photosynthesis faster. But with the lamp at 40 cm it made almost no difference (5.5 in water, 6 with sodium hydrogencarbonate). In dim light, the light was holding the rate back, so extra carbon dioxide could not help.
Sodium hydrogencarbonate is not food for the plant. It supplies carbon dioxide, a raw material, and the plant still has to make its own glucose with it.
Temperature. Photosynthesis is a series of reactions controlled by enzymes in the chloroplasts. With the lamp at 10 cm and sodium hydrogencarbonate in the water, warming the water from 20 °C to 30 °C raised the rate from 27.5 to 36.5 bubbles per minute: the enzymes work faster when warmer. At 40 °C it fell to 18.5. Above their optimum the enzymes start to be denatured: their shape changes, and they work more slowly. Of the three temperatures tested, the rate was fastest at 30 °C, so the optimum for this plant is somewhere near 30 °C. The pondweed was still giving off bubbles at 40 °C, so the heat had not killed it at once. But denatured enzymes do not go back to their working shape when the water cools, so a plant overheated for long does not recover at once.
 (enlarge)
Trap: "The closer the lamp, the faster the rate, without end." The rate rises as the light gets brighter, but only until something else, such as the carbon dioxide or the temperature, holds it back. Then the line levels off.
Trap: "At 40 °C the plant is dead." It was still giving off bubbles, only fewer. Its enzymes are being damaged; the plant has not been killed at once.
Warming the water also changes how much gas it can hold: warm water holds less dissolved gas than cold water. So a change in temperature can change the bubble count in more than one way, one more reason to treat bubbles as a rough measure.
Worked example
Gas in a narrow tube
Instead of counting bubbles, a pupil collects the gas from a sprig of pondweed in a narrow glass tube for 5 minutes and measures the length of the gas, with the water bath at 20 °C and a beaker of water between the lamp and the plant. With the lamp at 50 cm the gas is 3 mm long; at 25 cm, 9 mm; at 12 cm, 10 mm. Then, with the lamp still at 12 cm, she adds a little sodium hydrogencarbonate solution to the water, and the gas is 15 mm long. Describe and explain the results.
Light intensity. As the lamp comes closer, the light on the plant is brighter, and more gas collects in the same 5 minutes: 3 mm at 50 cm, 9 mm at 25 cm. So the rate of photosynthesis rises as the light intensity rises. From 25 cm to 12 cm it rises only from 9 mm to 10 mm: the rate levels off, because something other than light is now holding it back. Carbon dioxide. Sodium hydrogencarbonate is a source of carbon dioxide, so adding it raised the carbon dioxide concentration, and the gas rose to 15 mm: with more of this raw material the plant photosynthesised faster. So, at 12 cm, the carbon dioxide was what held the rate back. In each step only one thing was changed: the temperature stayed at 20 °C. Measuring the length of gas is better than counting bubbles, because bubbles are not all the same size.
Worked example
Variables for a temperature test
A pupil plans to find out how temperature affects the rate of photosynthesis of pondweed, using water baths at several temperatures between 10 °C and 50 °C. Name the independent, dependent and controlled variables, and predict the pattern of the results.
The independent variable is the temperature of the water bath, checked with the thermometer. The dependent variable is the number of bubbles per minute. The controlled variables are everything else: the same sprig, the lamp at one distance with the beaker of water to soak up its heat, the same water with the same sodium hydrogencarbonate in it (so the same supply of carbon dioxide), a wait of about 2 minutes at each new temperature, and two one-minute counts with their mean. The rate should rise as the water warms, because the enzymes that control photosynthesis work faster, up to an optimum; above the optimum the enzymes are denatured and the rate falls. Warm water also holds less dissolved gas, so a change in temperature can change the bubble count in more than one way: the counts stay a rough measure.
Supplement: limiting factors
This section is Supplement content (syllabus 6.1.11).
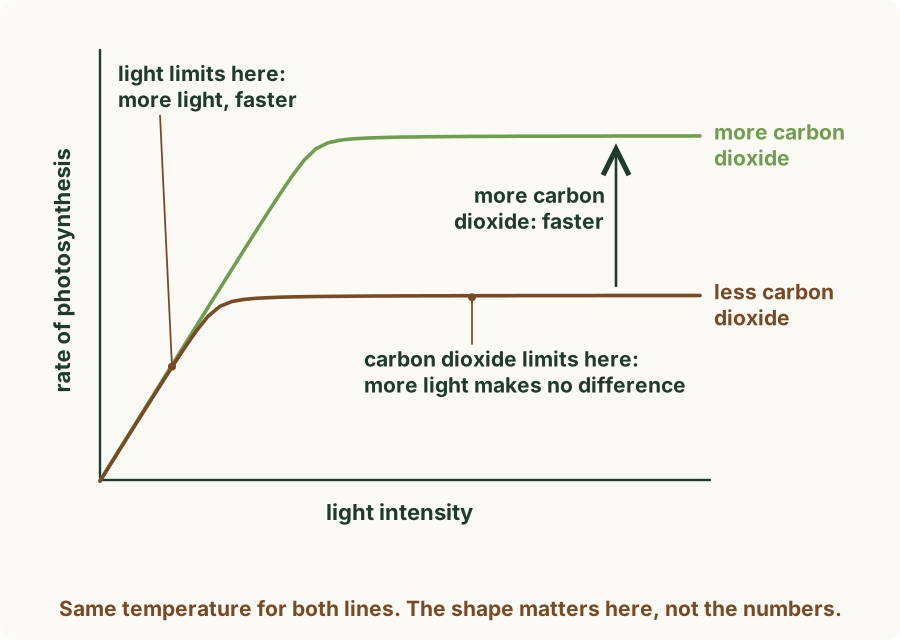
Photosynthesis needs light, carbon dioxide and a suitable temperature all at once. When one of them is in short supply, it holds the rate back, however much there is of the others. The factor in shortest supply is the limiting factor: increasing it increases the rate, and increasing any other factor does not.
Your counts show this:
- From 40 cm to 20 cm, moving the lamp closer raised the rate: light was the limiting factor.
- From 20 cm to 10 cm, more light hardly changed the rate. Adding sodium hydrogencarbonate at 10 cm raised it a lot: carbon dioxide was now the limiting factor.
- At 40 cm, adding sodium hydrogencarbonate hardly changed the rate: light was limiting there, so extra carbon dioxide could not help.
- At 10 cm with sodium hydrogencarbonate, warming the water from 20 °C to 30 °C raised the rate: temperature was limiting.
A graph shows a limiting factor by its shape. Where the line rises, the factor on the x-axis is limiting. On a graph against lamp distance, like yours, read it from right to left: a closer lamp gives brighter light. Where the line levels off (a plateau), something else is limiting. Raising that other factor lifts the plateau to a higher level.
 (enlarge)
Which factor limits a plant depends on its conditions:
- At dawn and dusk, at night, or in shade, the light is dim, so light is usually the limiting factor. At night there is no light, so there is no photosynthesis at all.
- On a bright, warm day, the leaves have plenty of light and warmth, so carbon dioxide is often the limiting factor. Air holds only a small amount of carbon dioxide (about 0.04%).
- On a bright but cold morning, the light is strong but the enzymes work slowly, so temperature is often the limiting factor.
That is how a greenhouse grower decides what to do. Heaters raise the temperature on cold days, lamps add light on dull days and in winter, and burning paraffin or gas, or a cylinder of carbon dioxide, raises the carbon dioxide concentration on bright days. Each costs money, so it is worth adding only the factor that is limiting at the time. Adding more of a factor that is not limiting does not raise the rate, and too much heat slows it.
Trap: "More carbon dioxide always makes photosynthesis faster." Only while carbon dioxide is the limiting factor. In dim light, light limits the rate, and more carbon dioxide makes almost no difference, as your counts at 40 cm showed.
Trap: "The limiting factor is the one the plant needs most." It is the one in shortest supply compared with what the plant could use at that moment. It changes during the day as the conditions change.
Worked example
Lamps or carbon dioxide in winter
Supplement. On a dull, overcast winter day, the heaters keep the lettuces in a greenhouse at 20 °C. The grower tries two changes, one at a time. Switching on extra lamps raises the rate of photosynthesis a lot; releasing extra carbon dioxide hardly changes it. Which factor is limiting the rate, and which change should she pay for?
Light is the limiting factor: on a dull winter day it is the factor in shortest supply. Extra lamps raised the rate, so light was holding it back. Extra carbon dioxide hardly changed the rate, because while light limits it, more of another factor cannot help. The heaters already keep the temperature suitable. So she should pay for the lamps, not for carbon dioxide. Once the lamps make the light bright, the rate will level off again, and then carbon dioxide or temperature may become the limiting factor: only then would extra carbon dioxide pay.
Key idea: The rate of photosynthesis of a water plant can be measured by counting the bubbles of gas, mostly oxygen, given off each minute: a rough but useful measure. Brighter light (a closer lamp) increases the rate until something else holds it back; more carbon dioxide increases the rate; warmer temperature increases the rate up to an optimum, and above it the enzymes are denatured and the rate falls. (Supplement) The factor in shortest supply is the limiting factor: increasing it increases the rate, and increasing other factors does not. Light usually limits at dawn, at dusk and in shade, carbon dioxide on a bright warm day, and temperature on a bright cold morning.