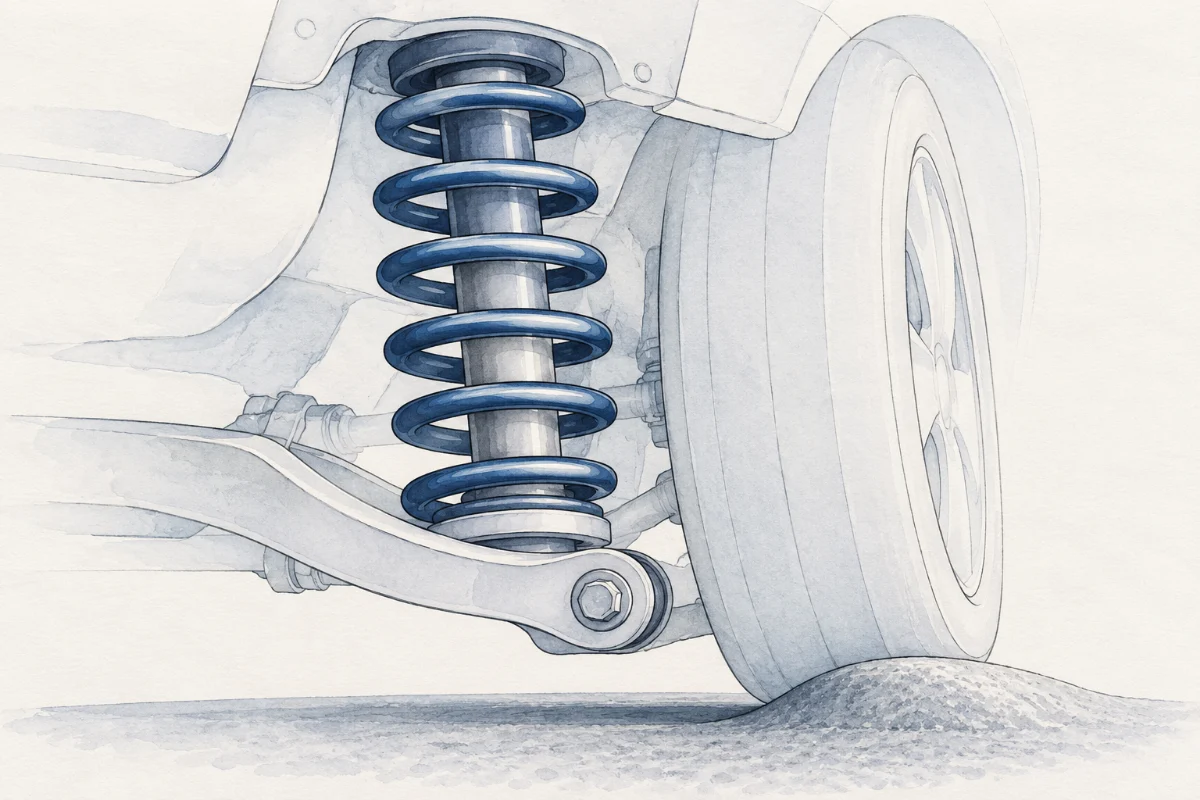
Push down hard on the corner of a car, and it sinks by only a centimetre or two. Above each wheel sits a coil spring, and your whole weight hardly squashes it. Yet a 100 g mass, which weighs less than 1 N, stretches a lab spring by several centimetres. Some springs are much harder to stretch or squash than others. How can you put a number on that? And does a spring keep stretching in proportion to its load however much you hang on it? Everything in this part is Supplement content.
 (enlarge)
Supplement: The spring constant
In part 1, every extra 100 g, a load of 0.98 N, stretched the same spring by the same amount. So each spring has its own number: how many newtons it takes for each metre of extension. This number is the spring constant, k. It is the force per unit extension:
k = F / x
Here F is the force on the spring (the load) in newtons, and x is the extension in metres. So k is measured in newtons per metre, N/m. A spring with k = 25 N/m needs 25 N for each metre of stretch, or 0.25 N for each centimetre. Rearranged, the equation also gives the force, F = k x, or the extension, x = F / k.
Lab extensions are measured in centimetres, so change them to metres first: divide by 100. An extension of 4.0 cm is 0.040 m.
Trap: “The spring constant is 0.25 N/m.” A pupil divides 0.98 N by 3.9 cm and gets about 0.25. But that is 0.25 newtons per centimetre. There are 100 cm in a metre, so 1 N/cm = 100 N/m, and 0.25 N/cm = 25 N/m. Change the extension to metres before you divide, and the unit takes care of itself.
Free play: nothing here is marked or saved
Lean on the car
Lean on the corner of a car and the spring above the wheel gets shorter. For a squashed spring, x is how much shorter it gets, and x = F / k. How far does a hard push squash a car’s spring?Supplement
Try: Push twice as hard. What happens to x?
- Push F
- 300 N
- Spring constant k
- 30 000 N/m
- Squashed by x
- 1.0 cm
x = F / k = 300 N ÷ 30 000 N/m = 0.010 m = 1.0 cm
k = 30 000 N/m, or 300 N per cm of squash
- Even the hardest push here squashes the car’s spring by 4 cm at most. A car’s spring constant is tens of thousands of newtons per metre; a spring you can stretch with one finger has only tens of newtons per metre.
- Halve k and the same push squashes the spring twice as far; push twice as hard and it goes twice as far too. Both follow from x = F / k.
- The car’s own weight already squashes the spring, so x is measured from where the spring sat before the push, as an extension is measured from the spring’s length before the load.
About this model. One spring takes the whole push here; on a real car the other springs take some of it and the car tips a little. The spring is drawn straight above the wheel. The car sinks by the true amount, a few pixels at most, and the lens shows the top of the spring 10 times bigger: the dashed outline is where its top plate sat before the push. A stiffer spring is drawn with thicker wire. The pushes stay below the spring’s limit of proportionality, so x is proportional to F. A push of 600 N is about the weight of a 61 kg person, with g = 9.8 N/kg.
Worked example
A gate spring
A spring that pulls a garden gate shut is tested. A force of 6.0 N stretches it by 4.0 cm. Find its spring constant, and then the extension when the force is 9.0 N.
First change the extension to metres: 4.0 cm = 0.040 m. Then k = F / x = 6.0 N ÷ 0.040 m = 150 N/m. For 9.0 N, rearrange: x = F / k = 9.0 N ÷ 150 N/m = 0.060 m = 6.0 cm. Check: 9.0 N is one and a half times 6.0 N, and 6.0 cm is one and a half times 4.0 cm, as it should be while the extension is proportional to the load. Dividing 6.0 by 4.0 instead gives 1.5, which is in N/cm, not N/m.
Supplement: The gradient of the graph is k
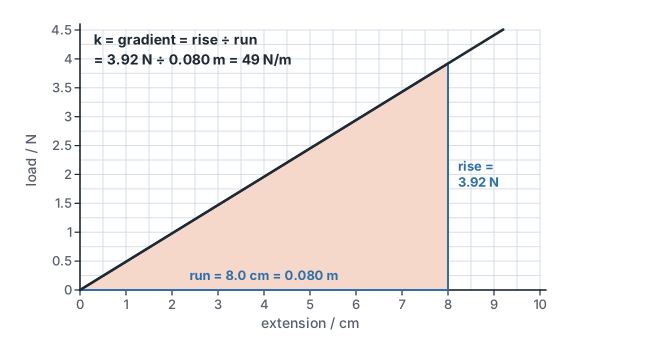
On a load–extension graph with the load up the side, the gradient of the straight line is the rise divided by the run: the load divided by the extension. That is exactly F / x, so the gradient is the spring constant. Use a big triangle, so the readings are easy to take, and change the run into metres.
 (enlarge)
The parcel spring of Worked example W02 has k = 3.92 N ÷ 0.080 m = 49 N/m. A stiffer spring, one that is harder to stretch, needs more newtons for each metre. So it has a bigger k and a steeper line. A softer spring has a smaller k and a less steep line: the same load stretches it further.
Some books draw the graph the other way round, with the extension up the side. Then the gradient is the extension divided by the load, x / F, which is 1/k. On that graph a steeper line means a softer spring. Always check which quantity is on which axis before you read the gradient.
Supplement: The limit of proportionality
A spring does not stay proportional for ever. Up to a certain load, the extension is proportional to the load and the graph is a straight line through the origin. Beyond that load, each extra newton stretches the spring by more than before, so the extension is no longer proportional to the load. The point where this changes is the limit of proportionality.
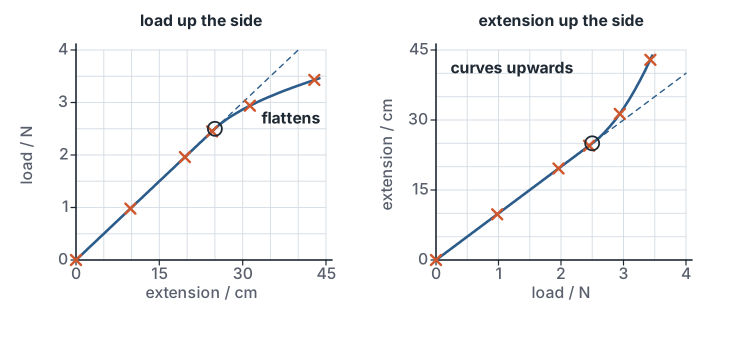
On a load–extension graph with the load up the side, the limit of proportionality is the point where the straight line ends and the graph starts to curve. Beyond it the graph flattens: it bends over towards the extension axis, because the extension now grows faster than the load. To identify the limit, find the last point that still lies on the straight line through the origin. Near the bend, add the load in smaller steps, so that there are more points close to the place where the line stops being straight.
Trap: “The limit of proportionality is the biggest load the spring can take.” It is not. Beyond the limit the spring still stretches and still holds the load. The extension just stops being proportional to the load.
Worked example
Finding the limit in a table
A pupil loads a spring in 2 N steps. Find the limit of proportionality and the spring constant.
| Load / N | 0 | 2 | 4 | 6 | 8 | 10 |
|---|---|---|---|---|---|---|
| Extension / cm | 0 | 2.5 | 5.0 | 7.5 | 10.4 | 14.0 |
Look at how much each 2 N step adds. From 0 to 6 N, each step adds 2.5 cm, so the extension is proportional to the load. From 6 N to 8 N the step adds 2.9 cm, and from 8 N to 10 N it adds 3.6 cm. The extension stops being proportional after 6 N, so the limit of proportionality is about 6 N. It could lie a little above 6 N, but before 8 N; smaller steps between 6 N and 8 N would pin it down. Use only the straight part for k: k = 2 N ÷ 0.025 m = 80 N/m. Using the 10 N row, 10 N ÷ 0.140 m ≈ 71 N/m, would be wrong, because that point is beyond the limit.
Find k, then load a softer spring
Back to the bench, with Supplement questions this time.
What is on the bench. The same clamped stand, metre rule, lens and catch tray, with spring A and its graph from part 1. Beside them hangs a second spring, spring B, made of thinner wire. There are 100 g and 50 g slotted masses. With spring B, the load–extension graph is drawn on the same axes as spring A’s.
What you do. First find the spring constant of spring A from its graph, in N/m. Then predict how far spring B will stretch for 100 g compared with spring A, and swap the springs. Its zero reading, with the empty hanger on, is written in for you. Add 100 g twice, and choose how big the next steps should be. Load spring B further, watch where the points go, and decide where the limit of proportionality is.
What the experiment showed
Do the experiment before you read on. Spring A’s line went through the point (15.7 cm, 3.92 N). Its gradient was 3.92 N ÷ 15.7 cm = 0.25 N/cm. In metres, 15.7 cm = 0.157 m, so k = 3.92 N ÷ 0.157 m ≈ 25 N/m. Typing 0.25 gives the right amount in the wrong unit, N/cm.
Spring B is softer: the same load stretched it further. With the empty hanger on, its pointer read 14.0 cm.
| Masses added | Load / N | Reading / cm | Extension / cm |
|---|---|---|---|
| none | 0 | 14.0 | 0 |
| 100 g | 0.98 | 23.8 | 9.8 |
| 200 g | 1.96 | 33.6 | 19.6 |
| 250 g | 2.45 | 38.5 | 24.5 |
| 300 g | 2.94 | 45.3 | 31.3 |
| 350 g | 3.43 | 56.9 | 42.9 |
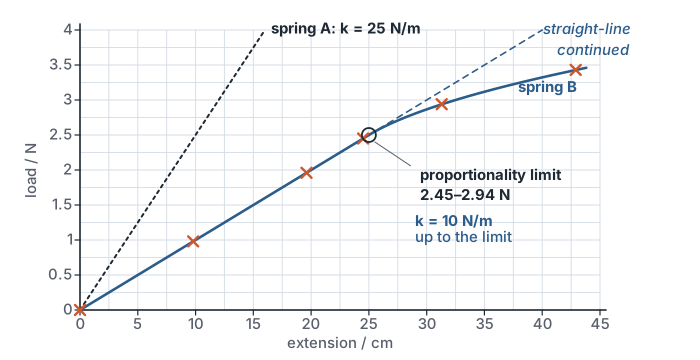
For the first three loads, spring B stretched by 9.8 cm for every 0.98 N. That is 0.10 N/cm, so k = 10 N/m, less than spring A’s 25 N/m, and its line was less steep.
After two 100 g steps, the masses went on 50 g at a time, so that there would be more points near any bend. The 250 g point, 2.45 N and 24.5 cm, was still on the straight line. Then the points left it:
- At 10 N/m, 2.94 N should give 29.4 cm, but the extension was 31.3 cm.
- 3.43 N should give 34.3 cm, but the extension was 42.9 cm.
Each 50 g now stretched the spring more than the one before, so the extension was no longer proportional to the load. The straight part ended somewhere between 2.45 N and 2.94 N: that is the limit of proportionality of spring B. Smaller steps in that range would pin it down more closely.
 (enlarge)
Supplement: Which way round are the axes?
The same results can be plotted two ways round, and the bend looks different. With the load up the side, the graph flattens beyond the limit of proportionality. With the extension up the side, it curves upwards and gets steeper. Both show the same thing: beyond the limit, each newton stretches the spring by more than before.
 (enlarge)
Trap: “The graph gets steeper, so the spring got stiffer.” That is only true with the load up the side. With the extension up the side, a steeper line means more extension for each newton: the spring is easier to stretch, not stiffer. Read the axis labels first. Whichever way round, the limit of proportionality is where the line stops being straight.
Worked example
A graph with the axes swapped
A pupil plots extension up the side against load along the bottom. The points lie on a straight line through the origin from (0, 0) to (4.0 N, 8.0 cm), and beyond 4.0 N the line curves upwards. Find the limit of proportionality and the spring constant.
The line stops being straight at 4.0 N, so the limit of proportionality is about 4.0 N. Here the gradient is extension ÷ load, 8.0 cm ÷ 4.0 N = 2.0 cm per newton. That is 1/k, not k. Use k = F / x with metres: k = 4.0 N ÷ 0.080 m = 50 N/m. The upward curve beyond 4.0 N means that each newton stretches the spring more than before.
Case closed
A car spring and a lab spring differ in their spring constant. Spring A needed 25 N for each metre of stretch, and spring B only 10 N/m. A car’s suspension spring is far stiffer, often tens of thousands of newtons per metre, so even a person leaning on the car squashes it by only a centimetre or two. Spring constants are measured from the gradient of the straight part of the load–extension graph, with the extension in metres. Every spring also has a limit of proportionality. Beyond it the line stops being straight, and the spring constant no longer describes the spring.
About this model
The springs are simulated. Spring A follows k = 25 N/m for every load used. Spring B follows k = 10 N/m up to its limit of proportionality at 2.5 N; beyond it the model adds a little more extension for each newton, which grows faster the further past the limit the load goes. A real spring’s limit depends on its wire and how it was wound, and it is often less sharp than in the model. Readings are worked out to the nearest 0.1 cm, and g = 9.8 N/kg. Whether a spring goes back to its original length when the load is taken off depends on a different point, the elastic limit, which is beyond this course.