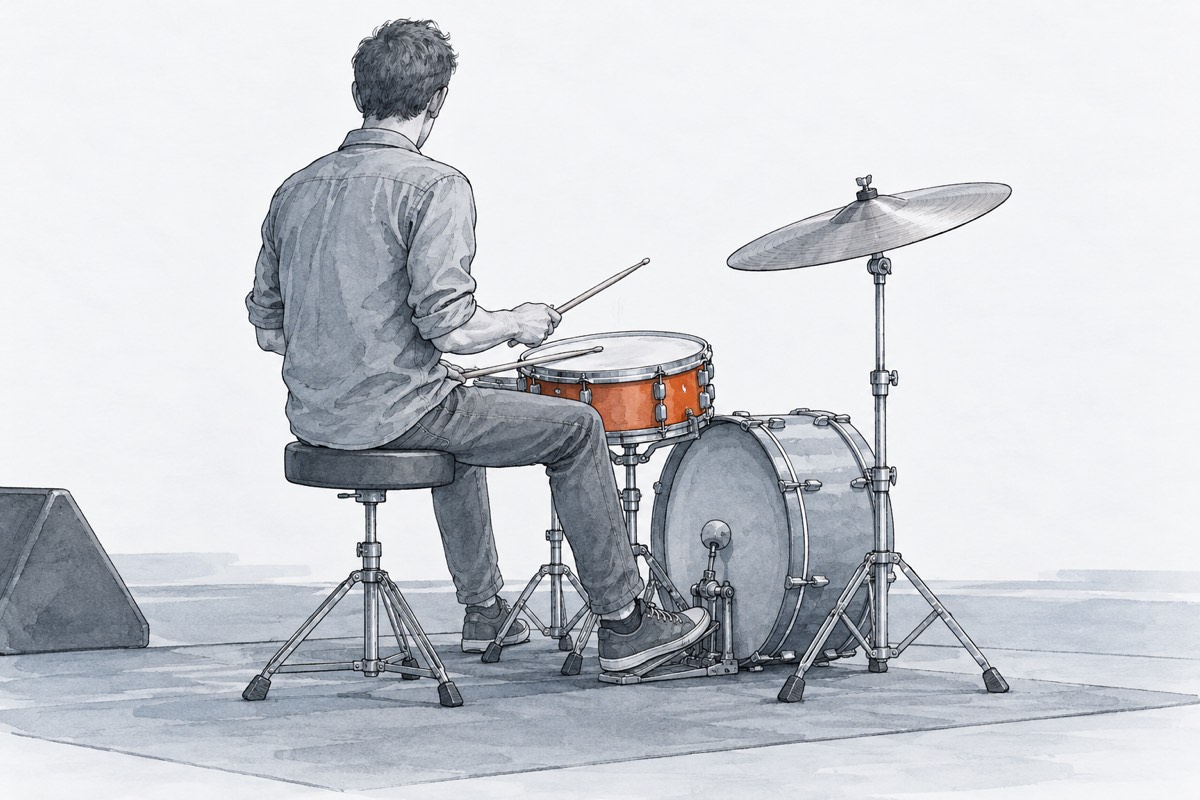
A drummer strikes a drum and lifts the stick away, but the sound continues for a moment. What keeps making it? And why can a small whistle sound higher than a large drum, even when the drum is louder? First predict what has to move. In this part you will follow that movement into the air, then use a microphone trace to separate pitch from loudness.
 (enlarge)
Something has to vibrate
When you strike a drum, its stretched head moves backwards and forwards about its resting position. This repeated movement is a vibration. The moving head pushes and pulls on the air next to it, starting a sound wave. The stick starts the movement; the vibrating drum head continues to produce the sound after the stick has left.
A plucked guitar string and the cone of a loudspeaker also vibrate. Their movement can be too small or too fast to see, so an apparently still source may still be making sound. When the vibration dies away, the source stops producing sound. Sound already travelling away can still reach a listener afterwards.
Worked example
After the stick leaves
A drum continues to sound after one strike. Name the vibrating source and explain how it starts sound in the air.
The stick is no longer touching the drum, but the stretched head keeps moving backwards and forwards. It pushes and pulls the nearby air, so the vibrating drum head is the source, and its movement starts a disturbance that travels through the air.
Along the air, backwards and forwards
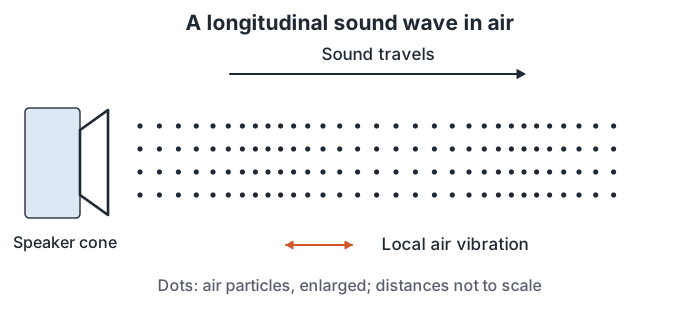
Imagine a loudspeaker facing right. Its cone moves right and left, making the nearby air particles move right and left too. Each small region of air passes the disturbance to the next. The disturbance and energy travel away from the speaker; the particles vibrate locally, rather than travelling all the way to your ear.
Sound in air is a longitudinal wave: the vibrations are parallel to the direction in which the wave travels. Parallel here means along the same line, including the backwards part of each vibration. A transverse wave, by contrast, has vibrations at right angles to its direction of travel, like a wave moving along a rope while the rope moves up and down. The shape of a drawn wavy line does not tell you which kind of wave it represents.
 (enlarge)
Trap: “The speaker blows the same air particles across the room.” Sound passes energy through the air while particles vibrate locally. A steady wind carrying air across the room is a different movement.
Supplement: Compressions and rarefactions
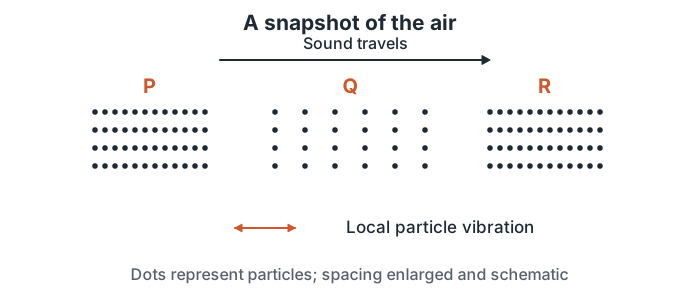
When the cone moves forward, it crowds the nearby air particles together. A region where the particles are closer together, with greater pressure and density than undisturbed air, is a compression. When the cone moves back, it leaves a region where particles are farther apart, with lower pressure and density: a rarefaction. Density means mass in a given volume, so more particles crowded into the same volume give greater density.
The alternating compressions and rarefactions travel through the air. A rarefaction still contains air particles; it is not an empty gap or a vacuum. A particle diagram is a greatly enlarged snapshot. It shows relative spacing, not the size of air particles, and the dots do not sit in neat rows in real air.
 (enlarge)
Worked example
Which way does the air move?
A sound wave travels right through the diagram. (a) How do the air particles vibrate? (b) Supplement: name P and Q and compare their pressure.
(a) They move right and left, parallel to the direction of travel, so this is a longitudinal wave. They do not move up and down. (b) P has closely spaced particles, so it is a compression with higher pressure. Q has more widely spaced particles, so it is a rarefaction with lower pressure. These travelling regions do not carry the same particles across the whole diagram.
What makes a note high or low?
A cone that completes 400 vibrations in one second has a frequency of 400 hertz, written 400 Hz. Frequency is the number of complete vibrations each second. A higher frequency gives a higher pitch, the quality that makes a note sound high rather than low. 1 kHz = 1000 Hz; the k means one thousand.
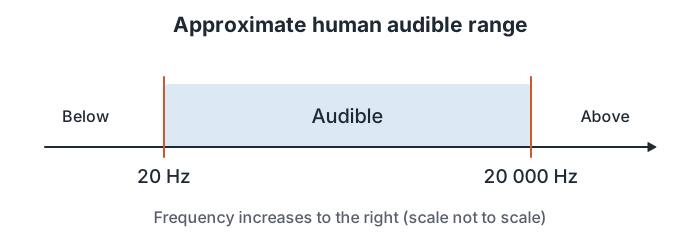
The approximate range of frequencies audible to humans is 20 Hz to 20 000 Hz. Audible means within the range a human can hear, provided the sound is strong enough. The limits vary between people and often narrow with age. Being inside this approximate range does not guarantee that a particular person will hear a very faint sound. A sound outside a person's hearing range can still exist.
 (enlarge)
Worked example
Three notes
A source produces notes of 10 Hz, 600 Hz and 25 000 Hz. Which lies in the approximate human audible range? Is 600 Hz higher or lower in pitch than 300 Hz?
Compare each frequency with both limits. 10 Hz is below 20 Hz and 25 000 Hz is above 20 000 Hz, so only 600 Hz lies inside the approximate range. It has twice the frequency of 300 Hz, so its pitch is higher. This tells us nothing about which note is louder.
Taller or more frequent?
Move the cone farther from its resting position each way and the amplitude increases. Amplitude is the greatest displacement from the resting position, rather than the whole distance from one extreme to the other. A larger sound-wave amplitude gives a louder sound; a smaller amplitude gives a quieter sound. Loudness is how loud or quiet a sound seems. For a fair comparison, keep the listener or microphone in the same place.
Frequency and amplitude can change separately. Making a note louder does not by itself make its pitch higher. Making it higher in pitch does not by itself make it louder.
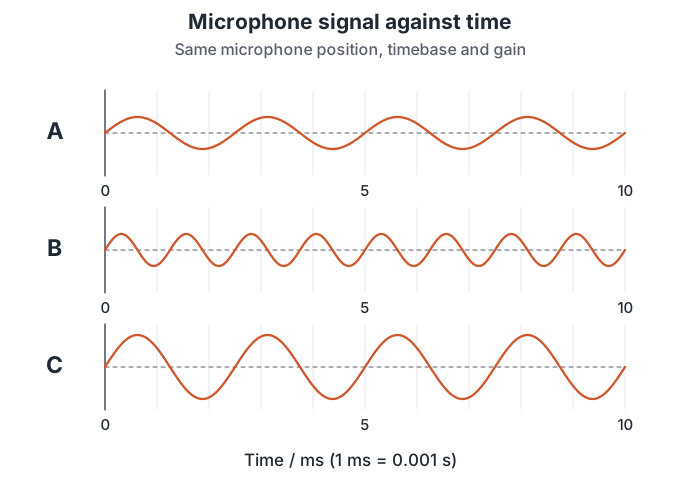
A microphone turns the changing sound pressure at one place into an electrical signal. An oscilloscope displays that signal against time: left to right means later, and height is the microphone signal relative to its centre line. A complete repeating pattern is one cycle. With the same microphone position and settings, a taller trace indicates greater sound amplitude; more cycles in the same time indicate higher frequency.
The trace is not a picture of the wave in the air. Its peaks do not show particles moving upwards, and horizontal peak spacing on this time graph is not a distance through the air. Keep the timebase (time represented across the screen) and gain (how strongly the signal is enlarged vertically) fixed when comparing traces. Changing gain alone can make the display taller without changing the sound.
 (enlarge)
Worked example
Read the traces
Compare A, B and C above. Which pair has the same pitch? Which trace represents the loudest sound? Assume the microphone stays in the same place, with timebase and gain fixed.
A and C both complete four cycles in the same 10 ms, so A and C have the same frequency and pitch. B completes eight cycles in that time, so it has higher frequency and pitch. C rises farther from its centre line than the others, so C has the greatest amplitude and represents the loudest sound. A and B have the same amplitude, so in this comparison they have the same loudness. The negative half of a trace is part of the signal, not “negative loudness”.
Trap: “More peaks means louder.” Count cycles to compare frequency and pitch. Compare height from the centre line to an extreme to compare amplitude and loudness, with the settings fixed.
Try the sound experiment
In the experiment you change the frequency and amplitude of a signal generator driving a loudspeaker, while a microphone feeds an oscilloscope. Predict which feature of the trace changes before turning each dial. The air magnifier lets you relate each particle's small vibration to the sound wave moving through the air. Supplement: in the magnifier, find where the particles crowd together (a compression) and where they spread apart (a rarefaction).
The experiment plays no sound, so compare the visible traces. The frequency dial has two stops, 200 Hz and 400 Hz, and the amplitude dial goes from 2 to 3. The cone and air motion are slowed down so that you can follow them; the screen is not a hearing test.
Ready for practice
You should now be able to identify a vibrating source, describe longitudinal motion, recall the approximate human audible range and distinguish pitch from loudness on a microphone trace. Supplement: explain how the particle spacing and pressure differ in compressions and rarefactions. The practice offers hints first, then new cases; its self-check criteria are teaching points, not official Cambridge marks.