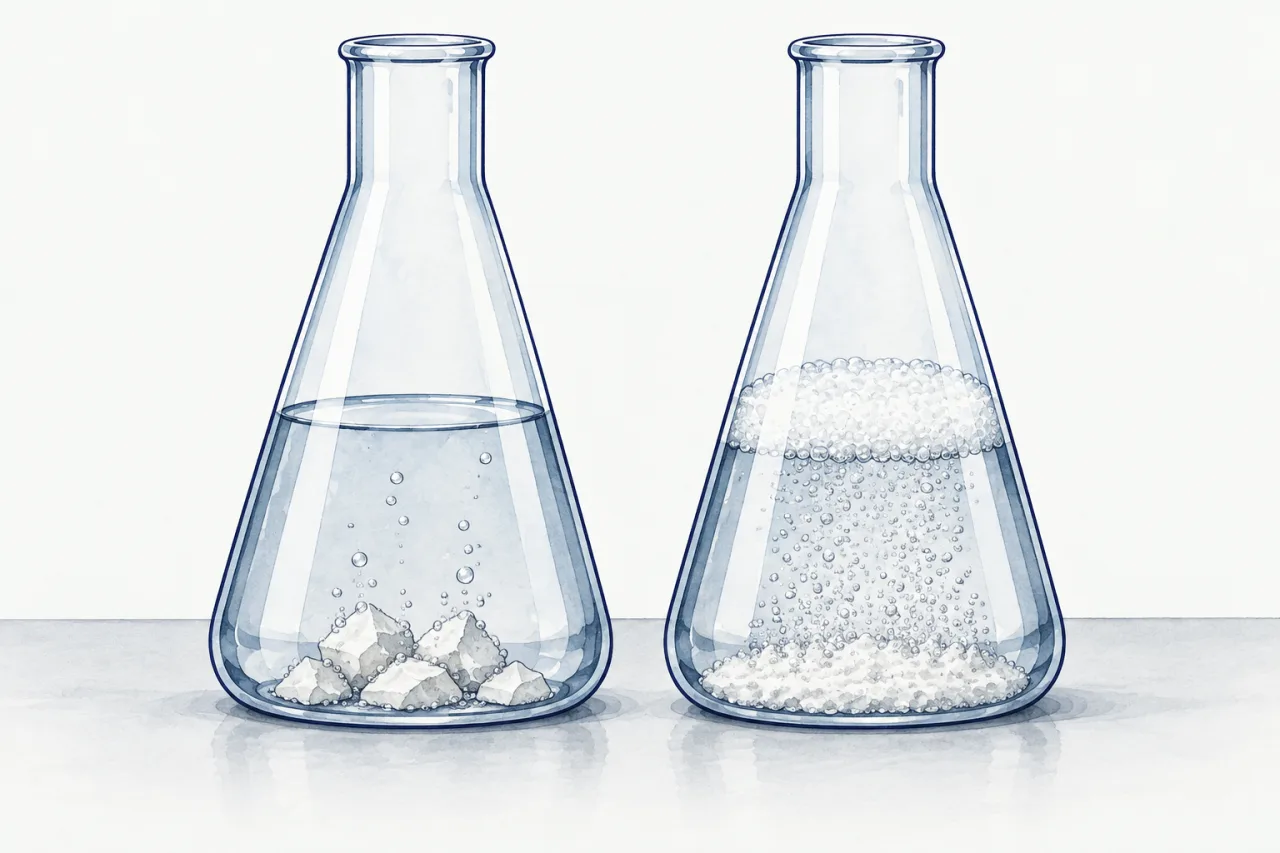
Drop a lump of marble into acid and it fizzes gently, a few bubbles at a time. Drop the same mass of marble as a powder into the same acid and it froths up at once. Both make carbon dioxide; one makes it far faster. But "faster" needs a number. How do you measure how fast a reaction goes, and does the faster one also make more gas? In this part you'll race marble against acid three times and turn the bubbles into a graph.
 (enlarge)
Your investigation
Your bench has a conical flask with a bung (a rubber stopper). A glass delivery tube leads from the bung to a gas syringe, held level in a clamp: as gas comes in, it pushes the plunger out, and the scale on the syringe shows the volume in cm³. In front of the flask are two watch glasses with the same mass of marble (calcium carbonate): lumps on one, powder on the other. There are two beakers of hydrochloric acid, an ordinary one and one at half the strength, and a stopclock. Every run uses 50 cm³ of acid and 1 g of marble: always more marble than the acid can react with.
calcium carbonate + hydrochloric acid → calcium chloride + water + carbon dioxide
For each run you pour acid into the flask, tip in the marble, and the bung goes in as the clock starts. The carbon dioxide pushes the plunger out, and a point goes on your graph every 20 seconds. You'll race three times: marble lumps first; then powder, after you predict its curve; then lumps again with the half-strength acid, which you set up yourself as a fair test. At the end you'll work out a rate from your graph.
What the syringe shows
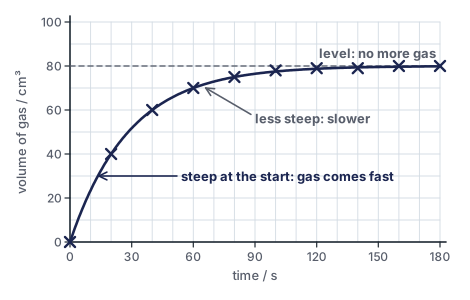
The lumps fizz steadily at first. The plunger slides out quickly, then more and more slowly, and after about three minutes it stops. These are the readings:
| Time / s | 0 | 20 | 40 | 60 | 80 | 100 | 120 | 140 | 160 | 180 |
|---|---|---|---|---|---|---|---|---|---|---|
| Volume of gas / cm³ | 0 | 40 | 60 | 70 | 75 | 78 | 79 | 79 | 80 | 80 |
In the first 20 seconds 40 cm³ of gas came off; in the next 20 seconds only 20 cm³; then 10; then 5. Plotted against time, the points make a curve that is steep at the start and gets less and less steep until it is flat.
 (enlarge)
When the curve goes flat, no more gas is coming off: the reaction has stopped. But there are still marble lumps in the flask. So what ran out? The acid. Marble was in excess, so the acid was the limiting reactant, and once it was used up the reaction stopped, with marble left over.
Working out a rate
The rate of a reaction is how fast a reactant is used up or a product is made. Here you can measure the product, the gas:
rate = volume of gas made ÷ time taken
Over the first 20 seconds the lumps made 40 cm³, so the rate was 40 ÷ 20 = 2 cm³/s: on average 2 cm³ of gas every second. Over the next 20 seconds it was only 20 ÷ 20 = 1 cm³/s.
The rate falls because the acid is being used up. There is less acid left to react each second, so less gas comes off. On the graph, the steepness (the gradient) shows the rate: steep means fast, less steep means slower, flat means stopped.
Key idea: On a graph of the amount of product against time, the steeper the curve, the faster the reaction. The curve is steepest at the start, gets less steep as a reactant is used up, and goes flat when the reaction stops. The height of the flat part is the total amount of product.
The powder and the half-strength acid
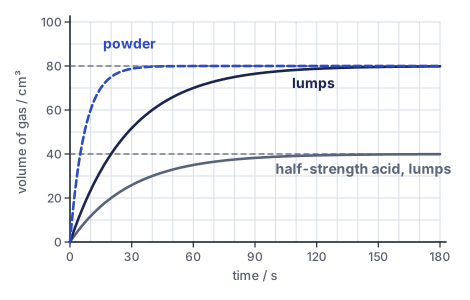
The powder froths up at once. Its curve shoots up: after 20 seconds the syringe already holds 75 cm³, and it is flat at 80 cm³ within about 40 seconds. That's the same 80 cm³ as the lumps, only much sooner. The powder made the gas faster but not more of it: the same amount of acid was used up both times.
The half-strength acid fizzes more slowly with the lumps. After 20 seconds there is only 20 cm³ of gas, and the curve goes flat at 40 cm³, half the volume. The same volume of half-strength acid contains only half as much acid, and the acid is the limiting reactant, so it makes only half as much gas before it runs out.
 (enlarge)
Trap: "The faster reaction makes more gas." The powder curve is steeper, but it levels off at the same height as the lumps. Speed and amount are separate questions: the rate says how fast, the limiting reactant says how much.
Worked example
Three curves
Use the three curves to compare the runs.
- Which run was fastest at the start? The powder: its curve is steepest at the start. Over the first 20 s its rate was 75 ÷ 20 ≈ 3.8 cm³/s, against 2 cm³/s for the lumps.
- Which runs made the same total volume of gas? The lumps and the powder: both curves level off at 80 cm³. They used the same amount of acid, and the acid ran out both times.
- Why does the half-strength curve level off lower? It started with half as much acid, so it made half as much gas, 40 cm³, before the acid ran out. Its rate over the first 20 s was 20 ÷ 20 = 1 cm³/s.
Another method: loss of mass
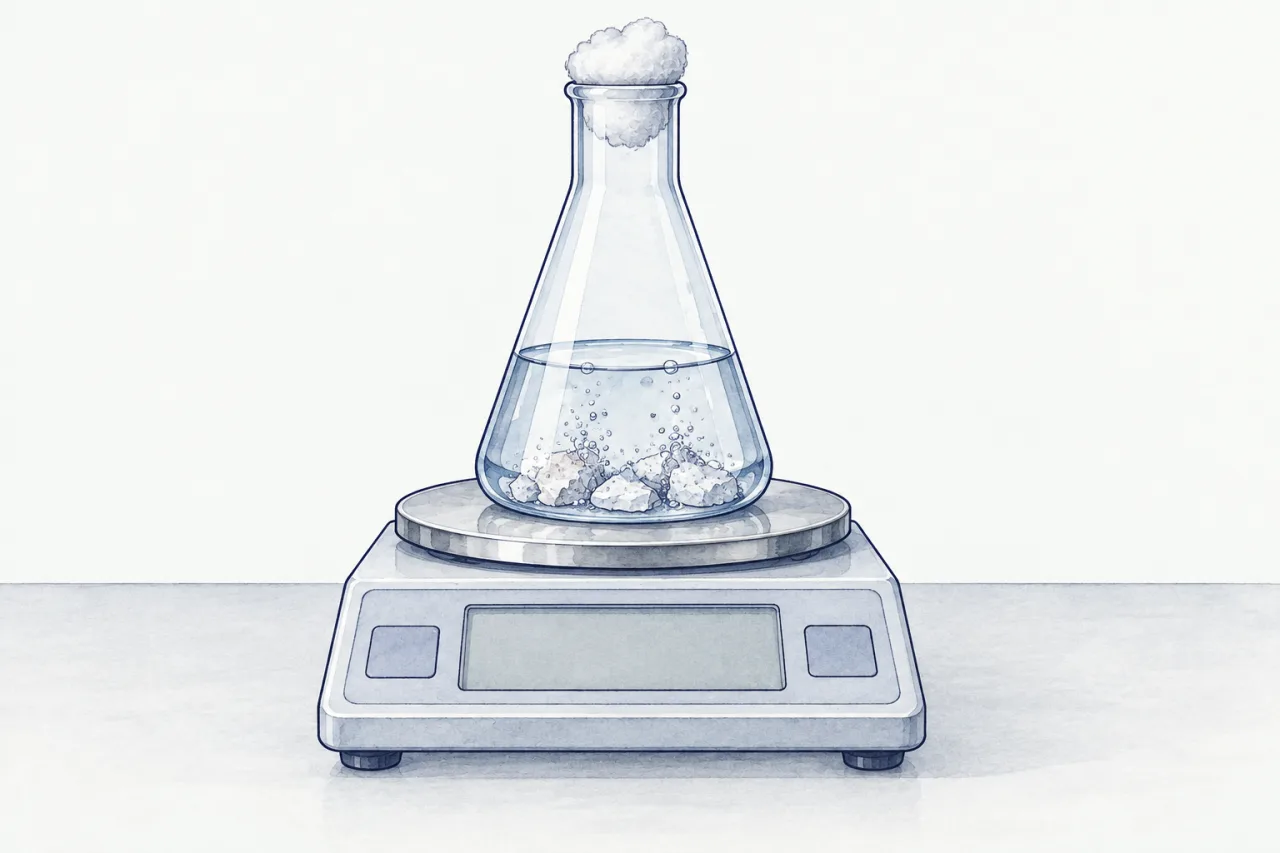
You can also follow this reaction on a balance. The flask of acid and marble stands on a balance, with a loose plug of cotton wool in its neck. As carbon dioxide escapes, the mass on the balance goes down. The cotton wool lets the gas out but stops drops of acid spraying out, which would add to the mass lost.
 (enlarge)
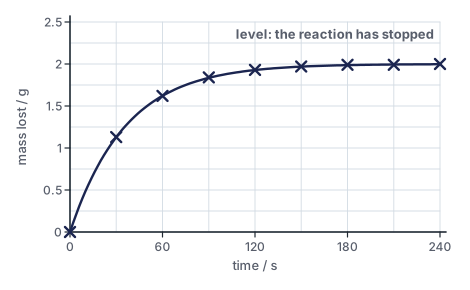
You read the balance at set times and work out the mass lost so far. The graph of mass lost against time has the same shape as the gas curve: steep at first, then less steep, then flat when the reaction stops.
 (enlarge)
Worked example
A table of masses
A flask of marble and acid on a balance gave these readings.
| Time / s | 0 | 30 | 60 | 90 | 120 | 150 | 180 | 210 | 240 |
|---|---|---|---|---|---|---|---|---|---|
| Mass / g | 152.40 | 151.27 | 150.78 | 150.56 | 150.47 | 150.43 | 150.41 | 150.41 | 150.40 |
- Mass lost in the first 30 s: 152.40 − 151.27 = 1.13 g.
- Rate over the first 30 s: 1.13 g ÷ 30 s ≈ 0.038 g/s.
- Total mass lost: 152.40 − 150.40 = 2.00 g. This is the mass of carbon dioxide that escaped.
- When did it stop? The mass hardly changes after about 180 s: the reaction has stopped.
Supplement: which method?
Both methods follow the same reaction, but each has weak points.
- Gas syringe. A little gas escapes in the moment before the bung goes in, so the volume reads slightly low. A plunger can stick, then jump. A syringe holds only about 100 cm³, so a reaction that makes more gas needs a smaller amount of reactants. Some gases dissolve in water, so a little can stay in the solution.
- Loss of mass. It doesn't work well for a light gas such as hydrogen: the same volume has so little mass that the balance hardly changes. The balance must show small changes (two decimal places for carbon dioxide). It does measure from the very start, and there is nothing to fill up or stick.
So for carbon dioxide either method works; for hydrogen, collect the gas.
Pause and check
A reaction makes 36 cm³ of gas in the first 30 seconds and 48 cm³ in total. What was the rate over the first 30 seconds, and what will the flat part of the curve show? Answer in your head, then read on.
The rate was 36 ÷ 30 = 1.2 cm³/s. The flat part of the curve will be at 48 cm³, the total volume of gas, once the limiting reactant is used up.
Case closed
How do you measure how fast a reaction goes? Follow a product (or a reactant) against time: collect the gas in a syringe, or watch the mass fall on a balance. The rate is the amount made divided by the time, and on a graph it is the steepness of the curve. The powder was faster than the lumps, yet both made 80 cm³, because the amount of gas is set by the limiting reactant, the acid. Half-strength acid made half the gas, more slowly. In the next part you'll find all five things that change how fast a reaction goes, and how to test one fairly.
About this model
The experiment is a model: the readings follow a smooth curve worked out from a simple rule, so a real class would see some scatter, and the reaction takes about three minutes of model time, played faster. Real marble is not pure calcium carbonate, and a powder can froth up the delivery tube; the model leaves both out. The gas is measured at room temperature and pressure. Your graph gets a point every 20 seconds, as you would plot it in the lab. While a race runs, the magnifier shows a model of acid particles reaching the marble; part 3 explains it. The table of masses in W02 comes from a separate, larger experiment.
For teachers: Core 6.2.3 and 6.2.4, Supplement 6.2.8 (Cambridge 0620 syllabus, p19). Builds on the limiting reactant and the gas syringe (moles and gas volumes); rate equations and half-lives are not in the syllabus.