Pupil sheet · Exercise and heart health
Exercise and the heart rate — questions
Name ______________________ Date ____________
Try every question before you use a nudge. Write in full sentences where you are asked to explain.
1. describe
The graph shows a second volunteer's heart rate before, during and after three minutes of stepping. Which describes the change?
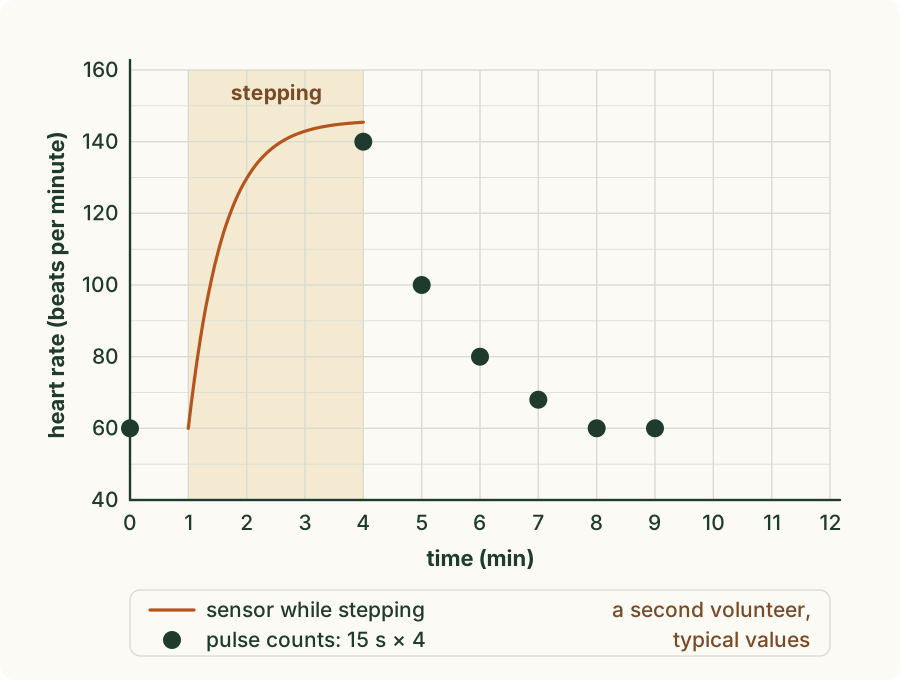
Circle one answer.
- It rose steadily all through the stepping; when the stepping stopped it fell back at once.
- It rose slowly at first, then faster; after the stepping it fell back over several minutes.
- It rose quickly, then levelled off; after the stepping it fell back over several minutes.
- It rose quickly, then levelled off; after the stepping it stayed level for several minutes.
Nudge (only if you are stuck): Look at the line during the shaded stepping, then at the dots after it.
2. determine
Use the graph. The recovery time is the time from the end of the stepping until the heart rate is back at the resting rate. Determine the recovery time.
Recovery time: ______________ unit ________
Nudge (only if you are stuck): Read two times from the axis: when the stepping stopped, and when the count was first back at the resting rate.
3. identify
A pupil wants to find out whether skipping or jogging on the spot raises his heart rate more. Which must stay the same so that the comparison is fair? Choose all that apply.
Tick every correct statement.
- the heart rate just after each activity
- the pupil who does both activities
- which activity is done
- a rest back to the resting rate before each one
- how long each activity lasts
Nudge (only if you are stuck): Only one thing should change between the two tests. Which of these is changed on purpose, and which is measured?
4. explain
Supplement. A cyclist rides up a steep hill. Put four of the steps in order to explain why her heart rate rises. One step does not belong in the explanation: leave it out.
Write the number of each step in order.
- cells in these muscles respire aerobically faster, using more oxygen and glucose
- her thigh muscles contract harder to push the pedals round
- her heart makes more energy and pumps it out to her thigh muscles
- her heart beats faster and pumps more blood with each beat
- each minute, more blood brings oxygen and glucose and takes away carbon dioxide
- Step 1: ______
- Step 2: ______
- Step 3: ______
- Step 4: ______
Nudge (only if you are stuck): Start with what her legs are doing, and check what the heart really pumps.
5. describe
The graph shows a third volunteer's heart rate during two 2-minute bouts of stepping, with 2 minutes' rest between them. Describe the effect of the two bouts on the heart rate. Use data from the graph.
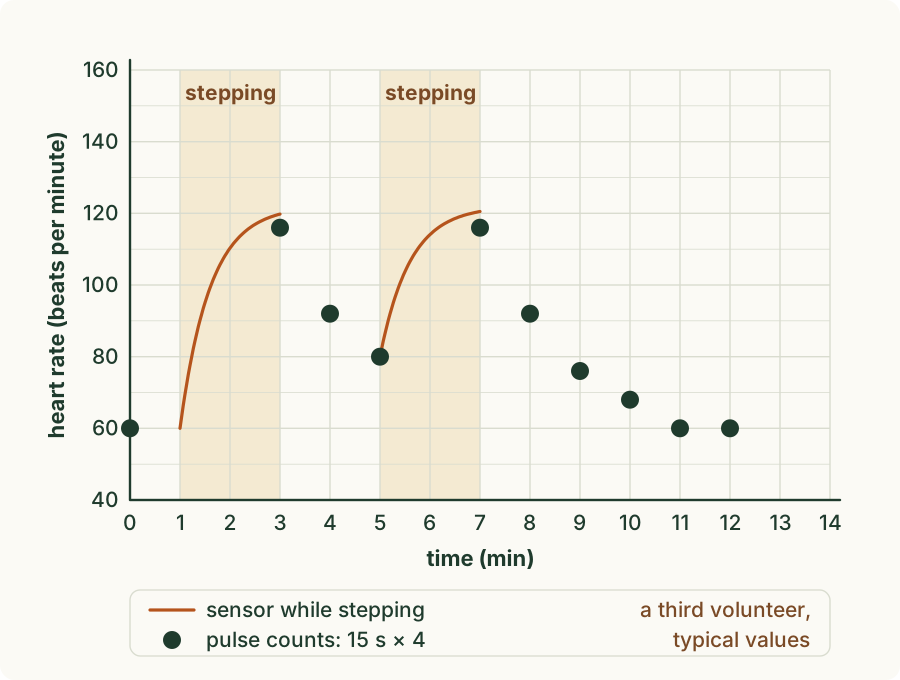
Nudge (only if you are stuck): Describe each stage in turn, and quote a value from the graph for each.
6. identify
A volunteer sits still, and his heart rate stays steady. Two pupils count his pulse at the same time, one at each wrist. P counts for 15 seconds and gets 15 beats. Q counts for one whole minute and gets 63 beats. Which statement is correct?
Circle one answer.
- Both are equally good, because both have been turned into beats per minute.
- P's 60 is better: in a short count there is less time to lose count of the beats.
- Q's 63 is better: at a steady rate, one missed beat changes it by 1, not by 4.
- P's 60 is better: a 15-second count catches the rate at the moment it is taken.
Nudge (only if you are stuck): Work out P's rate first. Is the rate changing here? What does multiplying by 4 do to a mistake in P's count?
7. identify
A cyclist wants a heart-rate reading every 30 seconds while she rides an exercise bike. Why should she wear a chest-strap sensor rather than count her pulse by hand?
Circle one answer.
- The pulse at the wrist is slower than the heart, so a hand count would read too low.
- Counting needs a still wrist and a free hand; the strap goes on recording as she rides.
- A count by hand must last a whole minute, so a reading every 30 seconds is impossible.
- The strap counts only the lub sounds, so it can never miss a beat as a hand count can.
Nudge (only if you are stuck): Think about her hands and her wrist while she rides.
8. explain
Supplement. A pupil writes: "During exercise the heart makes more energy and pumps it to the muscles." Explain why this is incorrect, and what the faster heart rate really does.
Nudge (only if you are stuck): What does the heart pump, and in which cells is the energy released?
9. identify
Supplement. A canoeist races 500 m as hard as she can. The table shows her heart rate and the lactic acid in her blood before and after the race. Which statement is correct and fits the data?
| Time | Heart rate / beats per minute | Lactic acid in the blood / mmol per dm³ |
|---|---|---|
| at rest, before the race | 62 | 1.0 |
| 5 min after the race | 126 | 12.0 |
| 15 min after the race | 103 | 9.0 |
| 30 min after the race | 87 | 5.0 |
| 45 min after the race | 75 | 2.6 |
| 60 min after the race | 65 | 1.2 |
Circle one answer.
- Her heart rate stays raised while her blood still has extra lactic acid to take to the liver.
- Her heart rate is back at its resting value well before the lactic acid begins to fall.
- The lactic acid stays at its highest until her heart rate is back at resting, then falls.
- The lactic acid is breathed out in the lungs, so it falls as her breathing slows down again.
Nudge (only if you are stuck): Read both columns at each time. Do they fall together, or does one fall only after the other?
10. describe
The table shows one person's heart rate after five minutes of different activities. Describe the relationship between the activity and the heart rate.
| Activity | Heart rate / beats per minute |
|---|---|
| sitting | 74 |
| walking | 98 |
| jogging | 136 |
| running fast | 172 |
Nudge (only if you are stuck): Put the activities in order from gentle to hard.
11. explain
Two groups each ran a step test, each with its own volunteer. Group 1 used a 30 cm step for 3 minutes. Group 2 used a 45 cm step for 2 minutes. Explain why their recovery times cannot be compared fairly.
Nudge (only if you are stuck): How many things are different between the two tests?
12. identify
Supplement. A person climbs the same stairs at the same speed twice, the second time carrying a heavy bag. Which row shows how the second climb compares with the first?
| Row | Oxygen used by the leg muscles | Carbon dioxide made by the leg muscles | Heart rate |
|---|---|---|---|
| A | higher | lower | higher |
| B | the same | the same | higher |
| C | higher | higher | higher |
| D | higher | higher | the same |
Circle one answer.
- A
- B
- C
- D
Nudge (only if you are stuck): Which muscles work harder with the bag, and what happens to their respiration?